
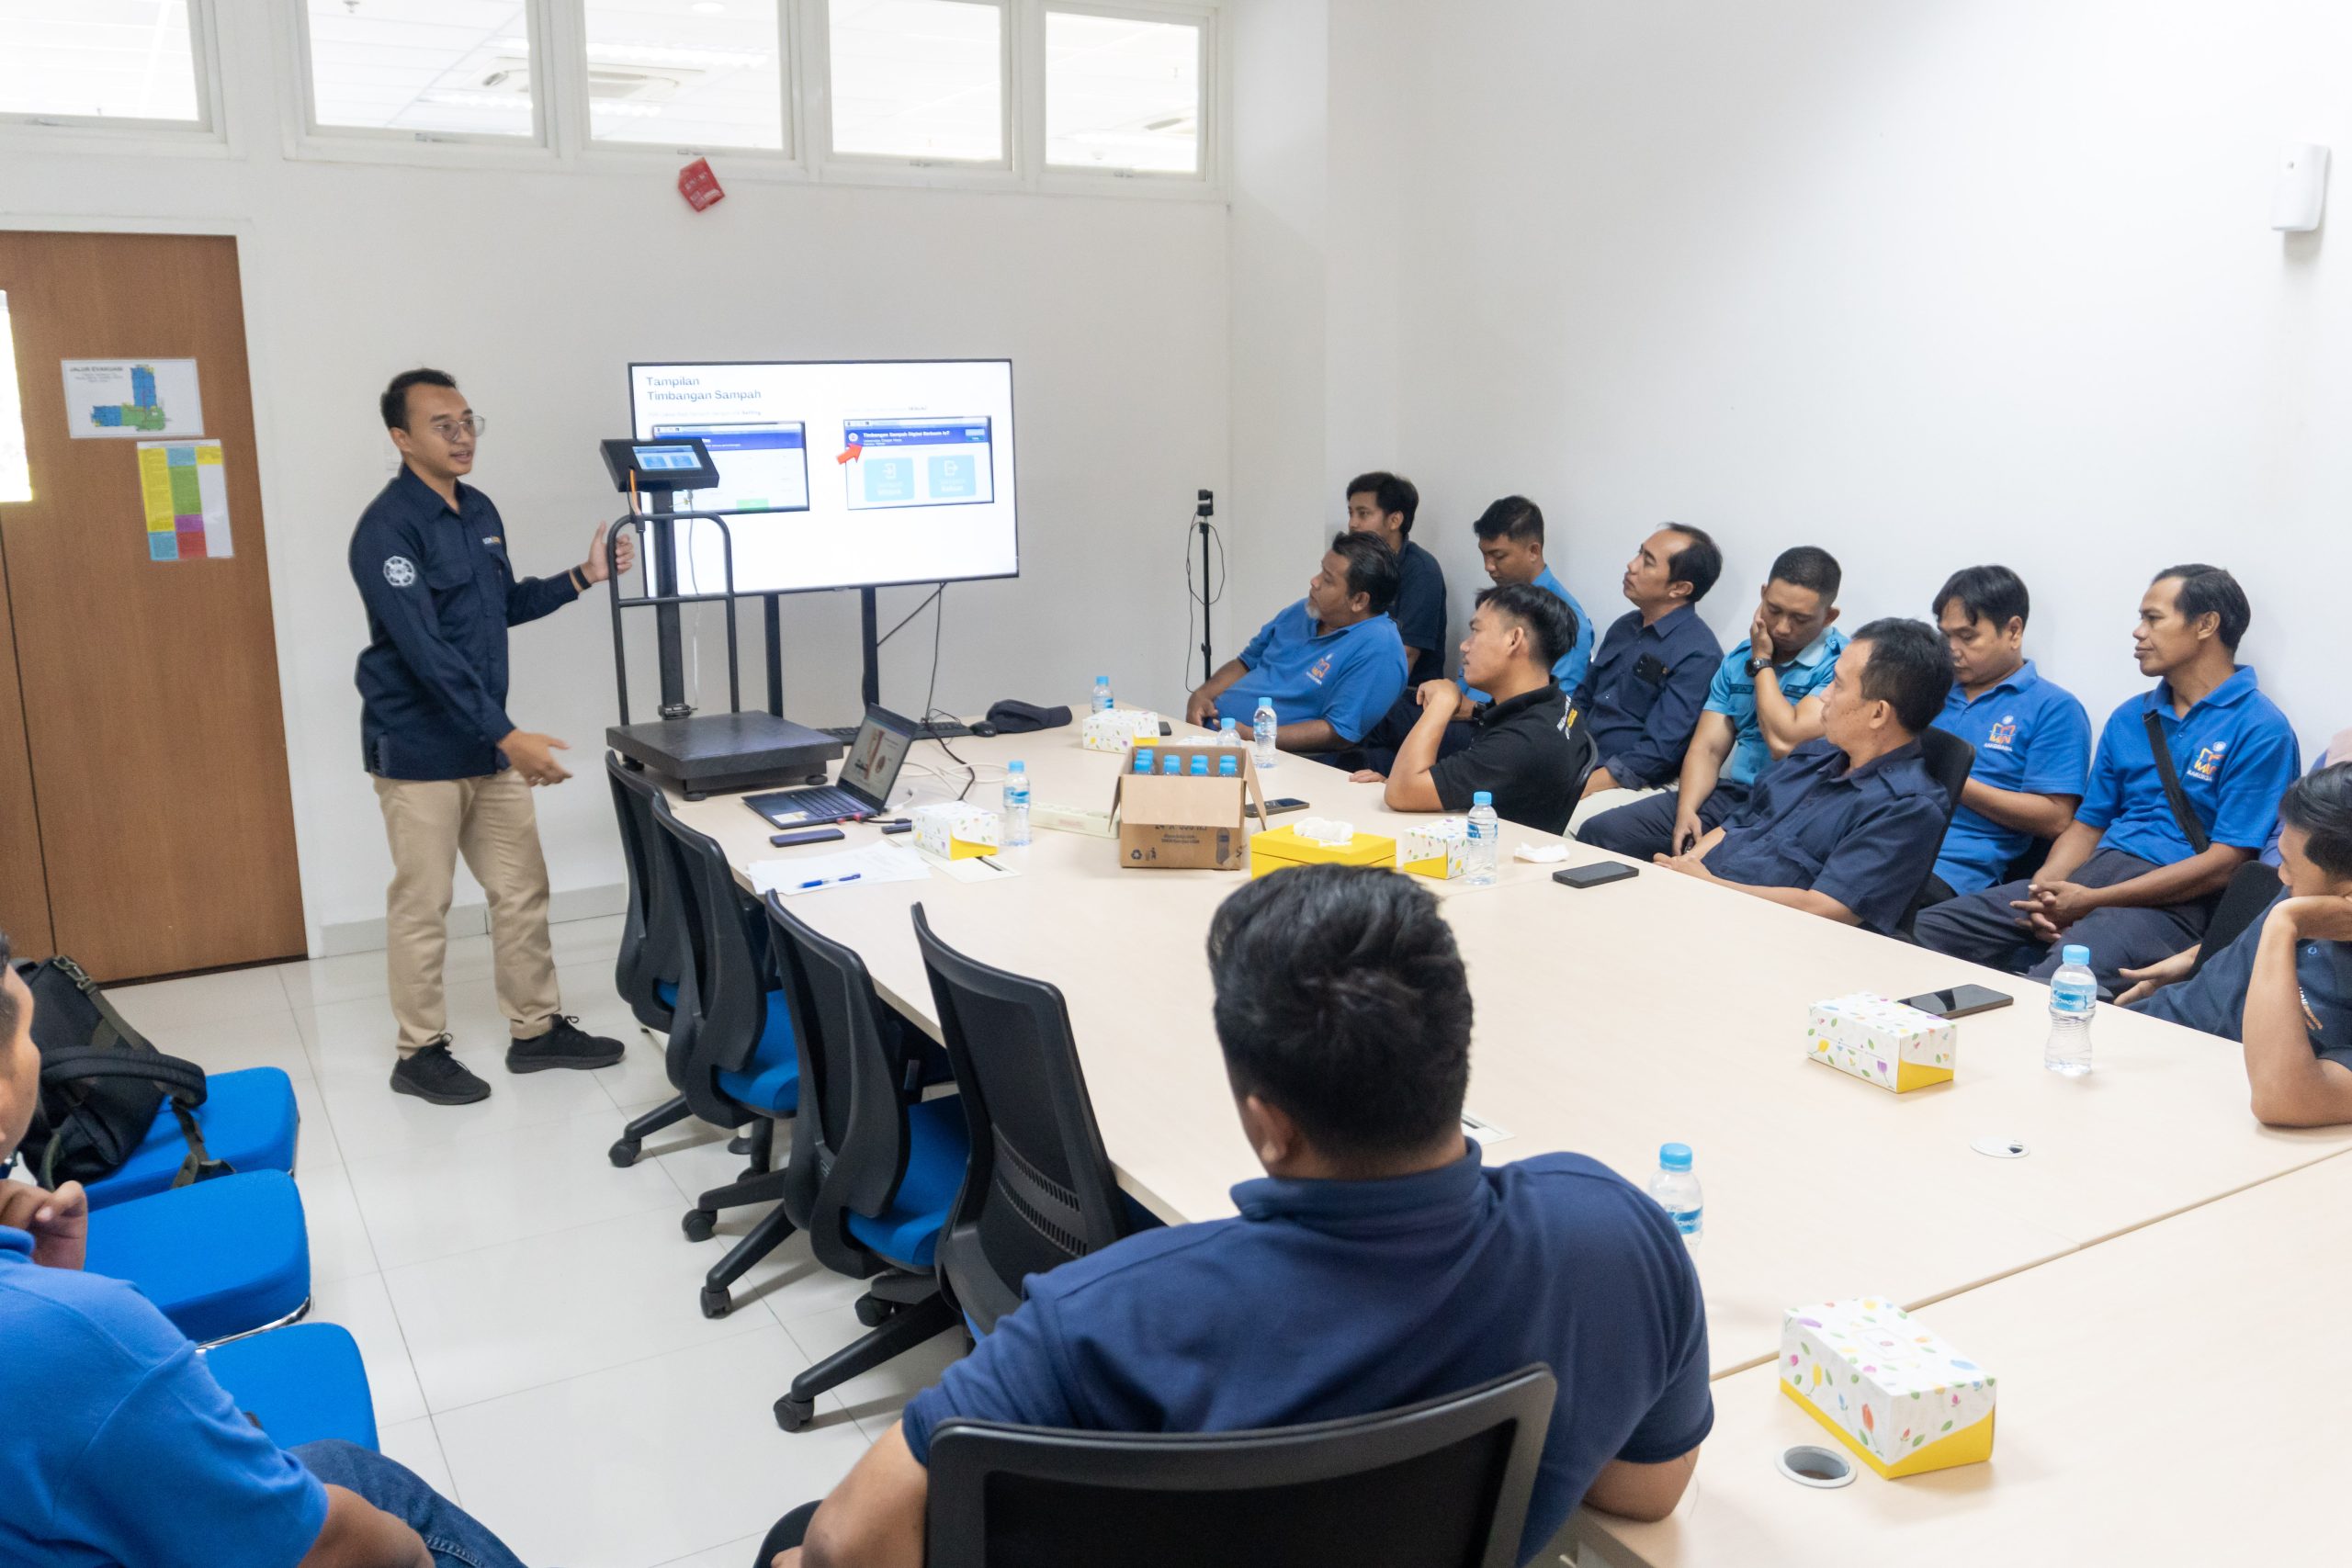
Effective waste management requires accurate data. Without knowing the amount and types of waste generated, waste reduction and processing efforts will be difficult to implement effectively. To support data-driven waste management, the Faculty of Dentistry (FKG) Universitas Gadjah Mada (UGM) invited Dr. Ir. Thomas Oka Pratama, M.Eng., to provide training on the use of an Internet of Things (IoT)-based waste scale for FKG UGM’s cleaning staff.
The Initial Idea
The development of the IoT-based waste scale began through a pilot project at the Faculty of Engineering UGM, which had been running for approximately two years. During the initial stage, the development team sought ways to measure the amount of waste generated while also understanding the composition of waste produced by each work unit.
Dr. Ir. Thomas Oka Pratama, S.T., M.Eng., a lecturer at the Department of Nuclear Engineering and Engineering Physics, Faculty of Engineering UGM, explained that this need became the starting point for the creation of the IoT waste scale system, which is now being introduced to various faculties across UGM.
“Initially, the Faculty of Engineering wanted to measure its waste production. From there, we developed a scale and discussed how to monitor the measurements while also identifying the components or types of waste generated,” he explained (3/6).
After the initial implementation showed promising results, the system began to be introduced to various faculties and work units at UGM so that waste data collection could be carried out through a more integrated approach. The socialization activity attended by FKG UGM was part of efforts to expand the utilization of this system across the university environment.
Features of the IoT Waste Scale
One of the main capabilities of the IoT waste scale is its ability to map the types and volumes of waste generated by each unit. Every incoming waste item can be categorized, such as residual waste, plastic, paper, or organic waste. This data is then combined with waste weight information, allowing users to view waste composition in greater detail.
Through the collected data, the university can identify the most dominant types of waste generated by each work unit. This information can be used to understand waste generation patterns while evaluating existing waste separation practices.
“We will know, for example, what type of waste is most dominant in a particular department. Is it residual waste, inorganic waste, or another type? From this data, management can observe existing conditions and develop appropriate policies,” Thomas explained.
In addition to providing more detailed data, the system is also equipped with a monitoring dashboard that allows information to be displayed on a single platform. Dashboard serves as a tool for managers to monitor waste generation trends from various units without requiring manual data compilation.
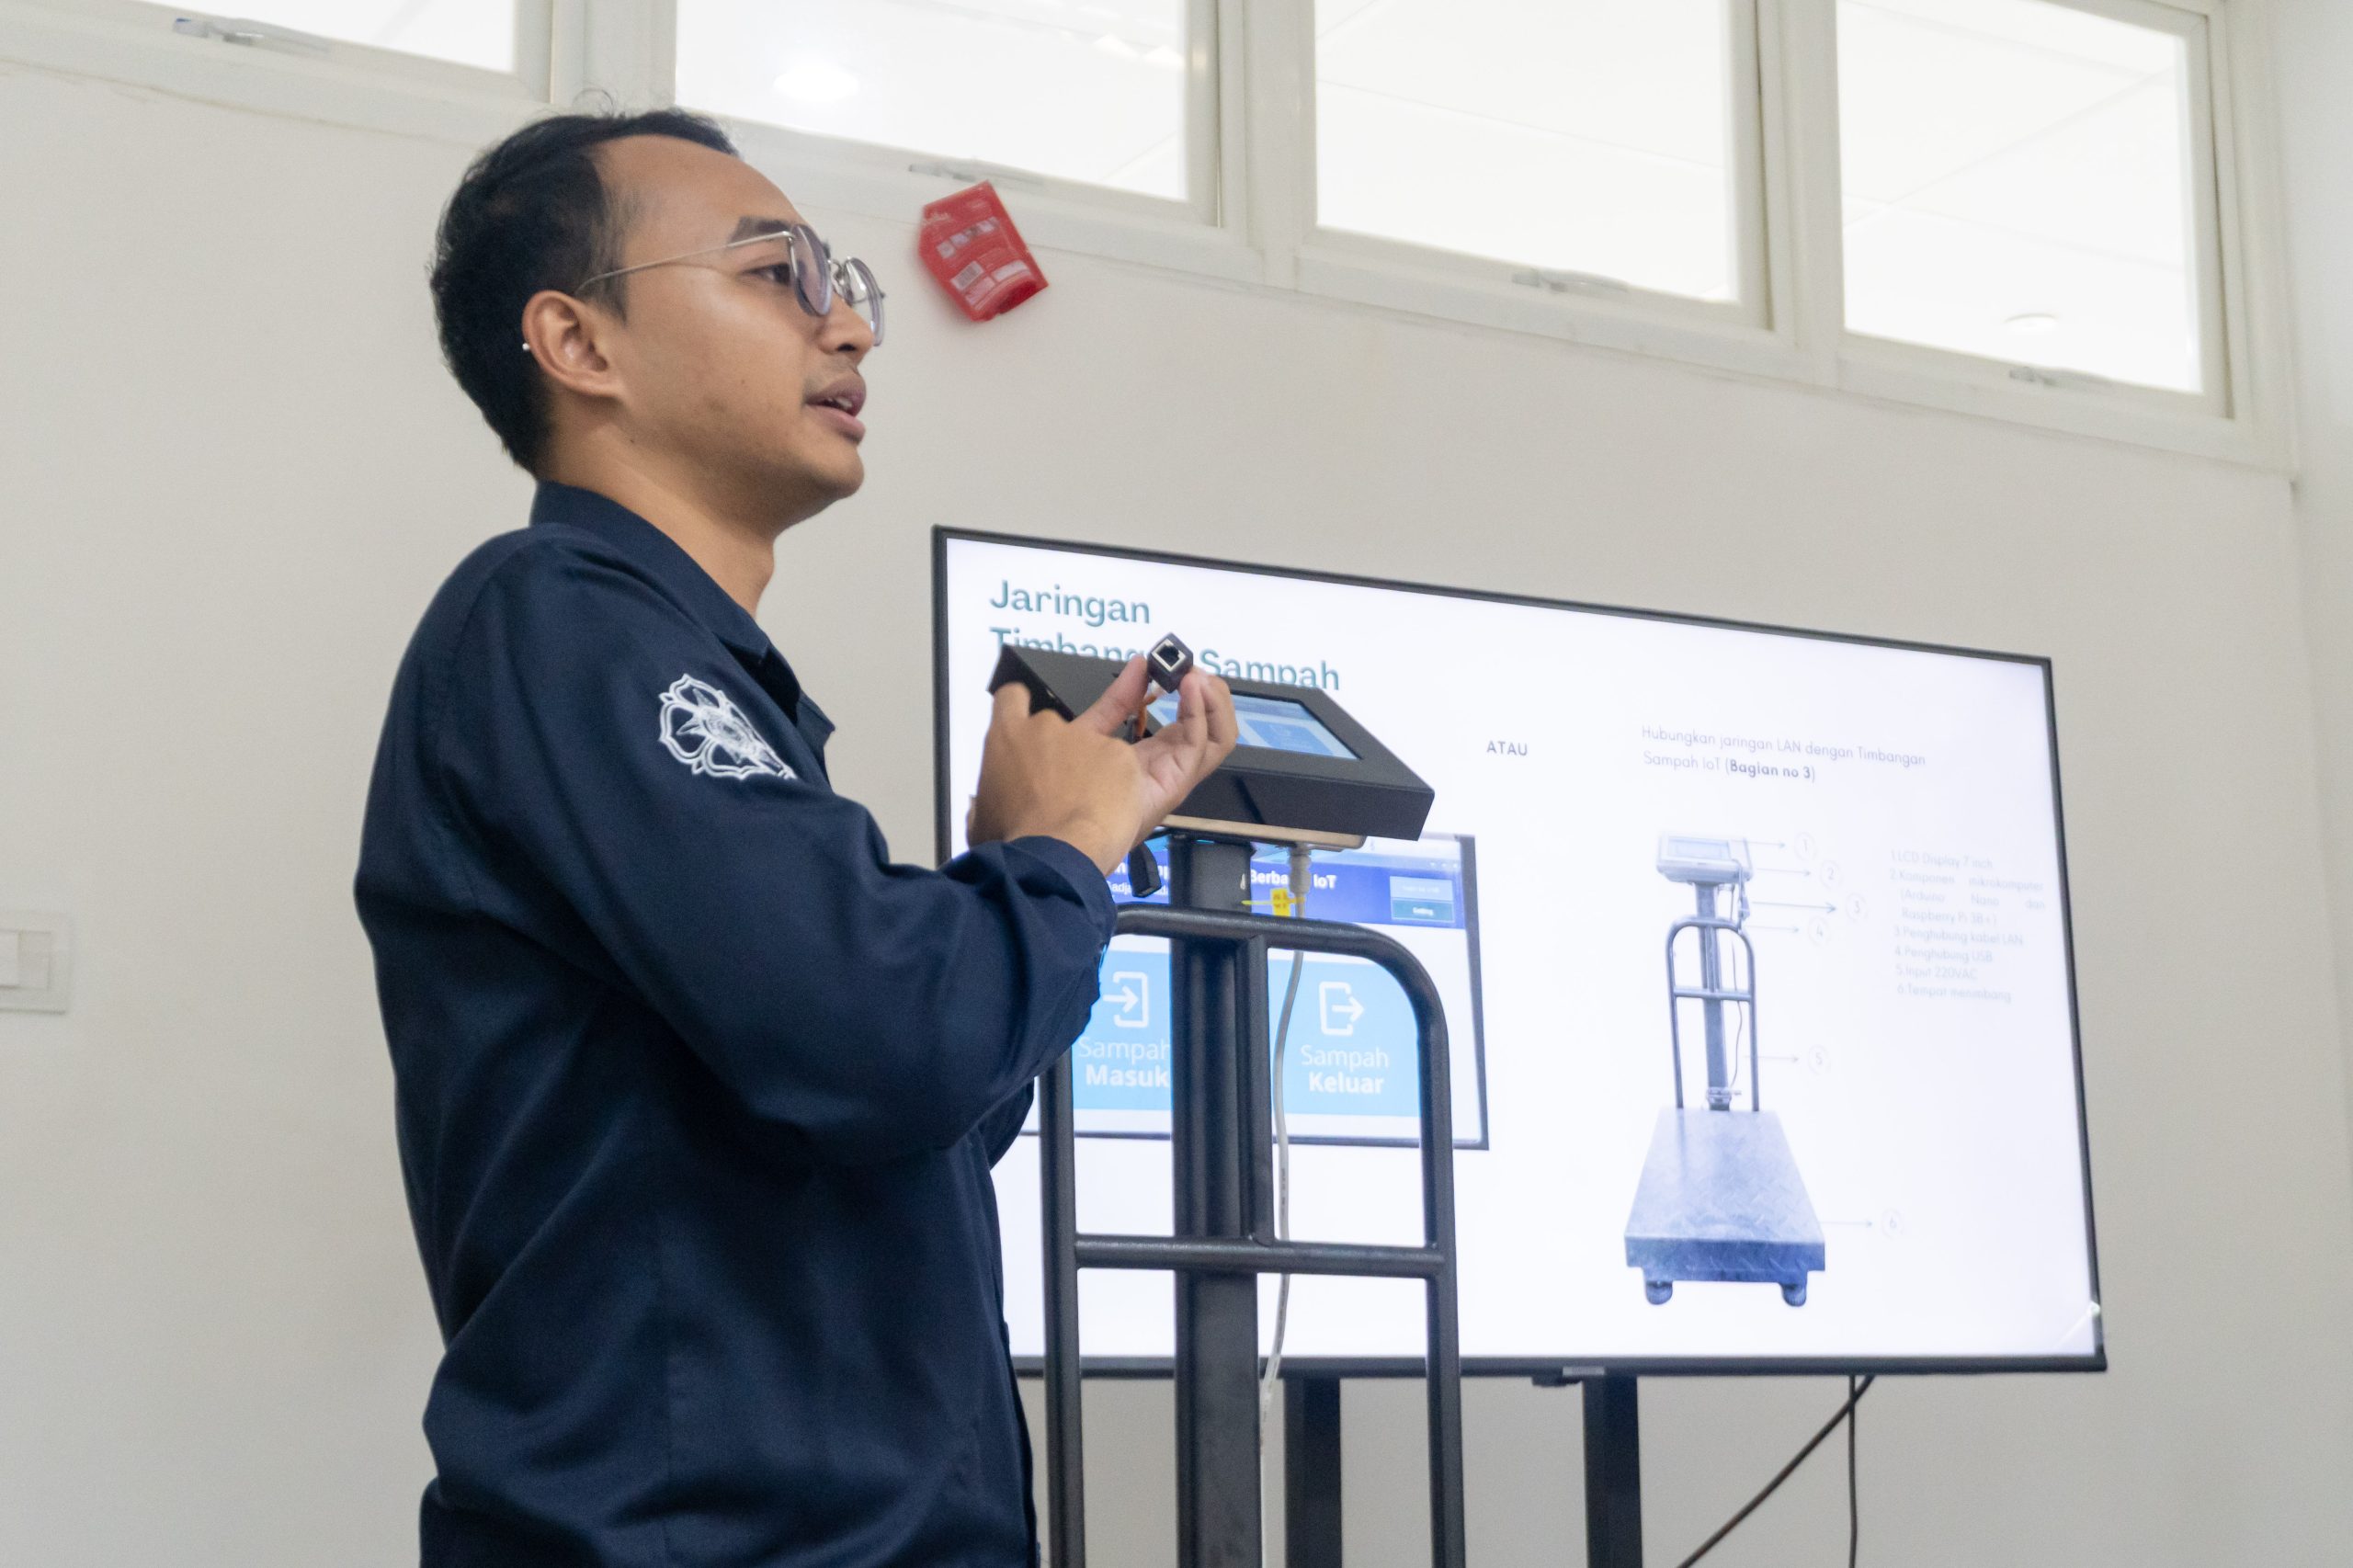
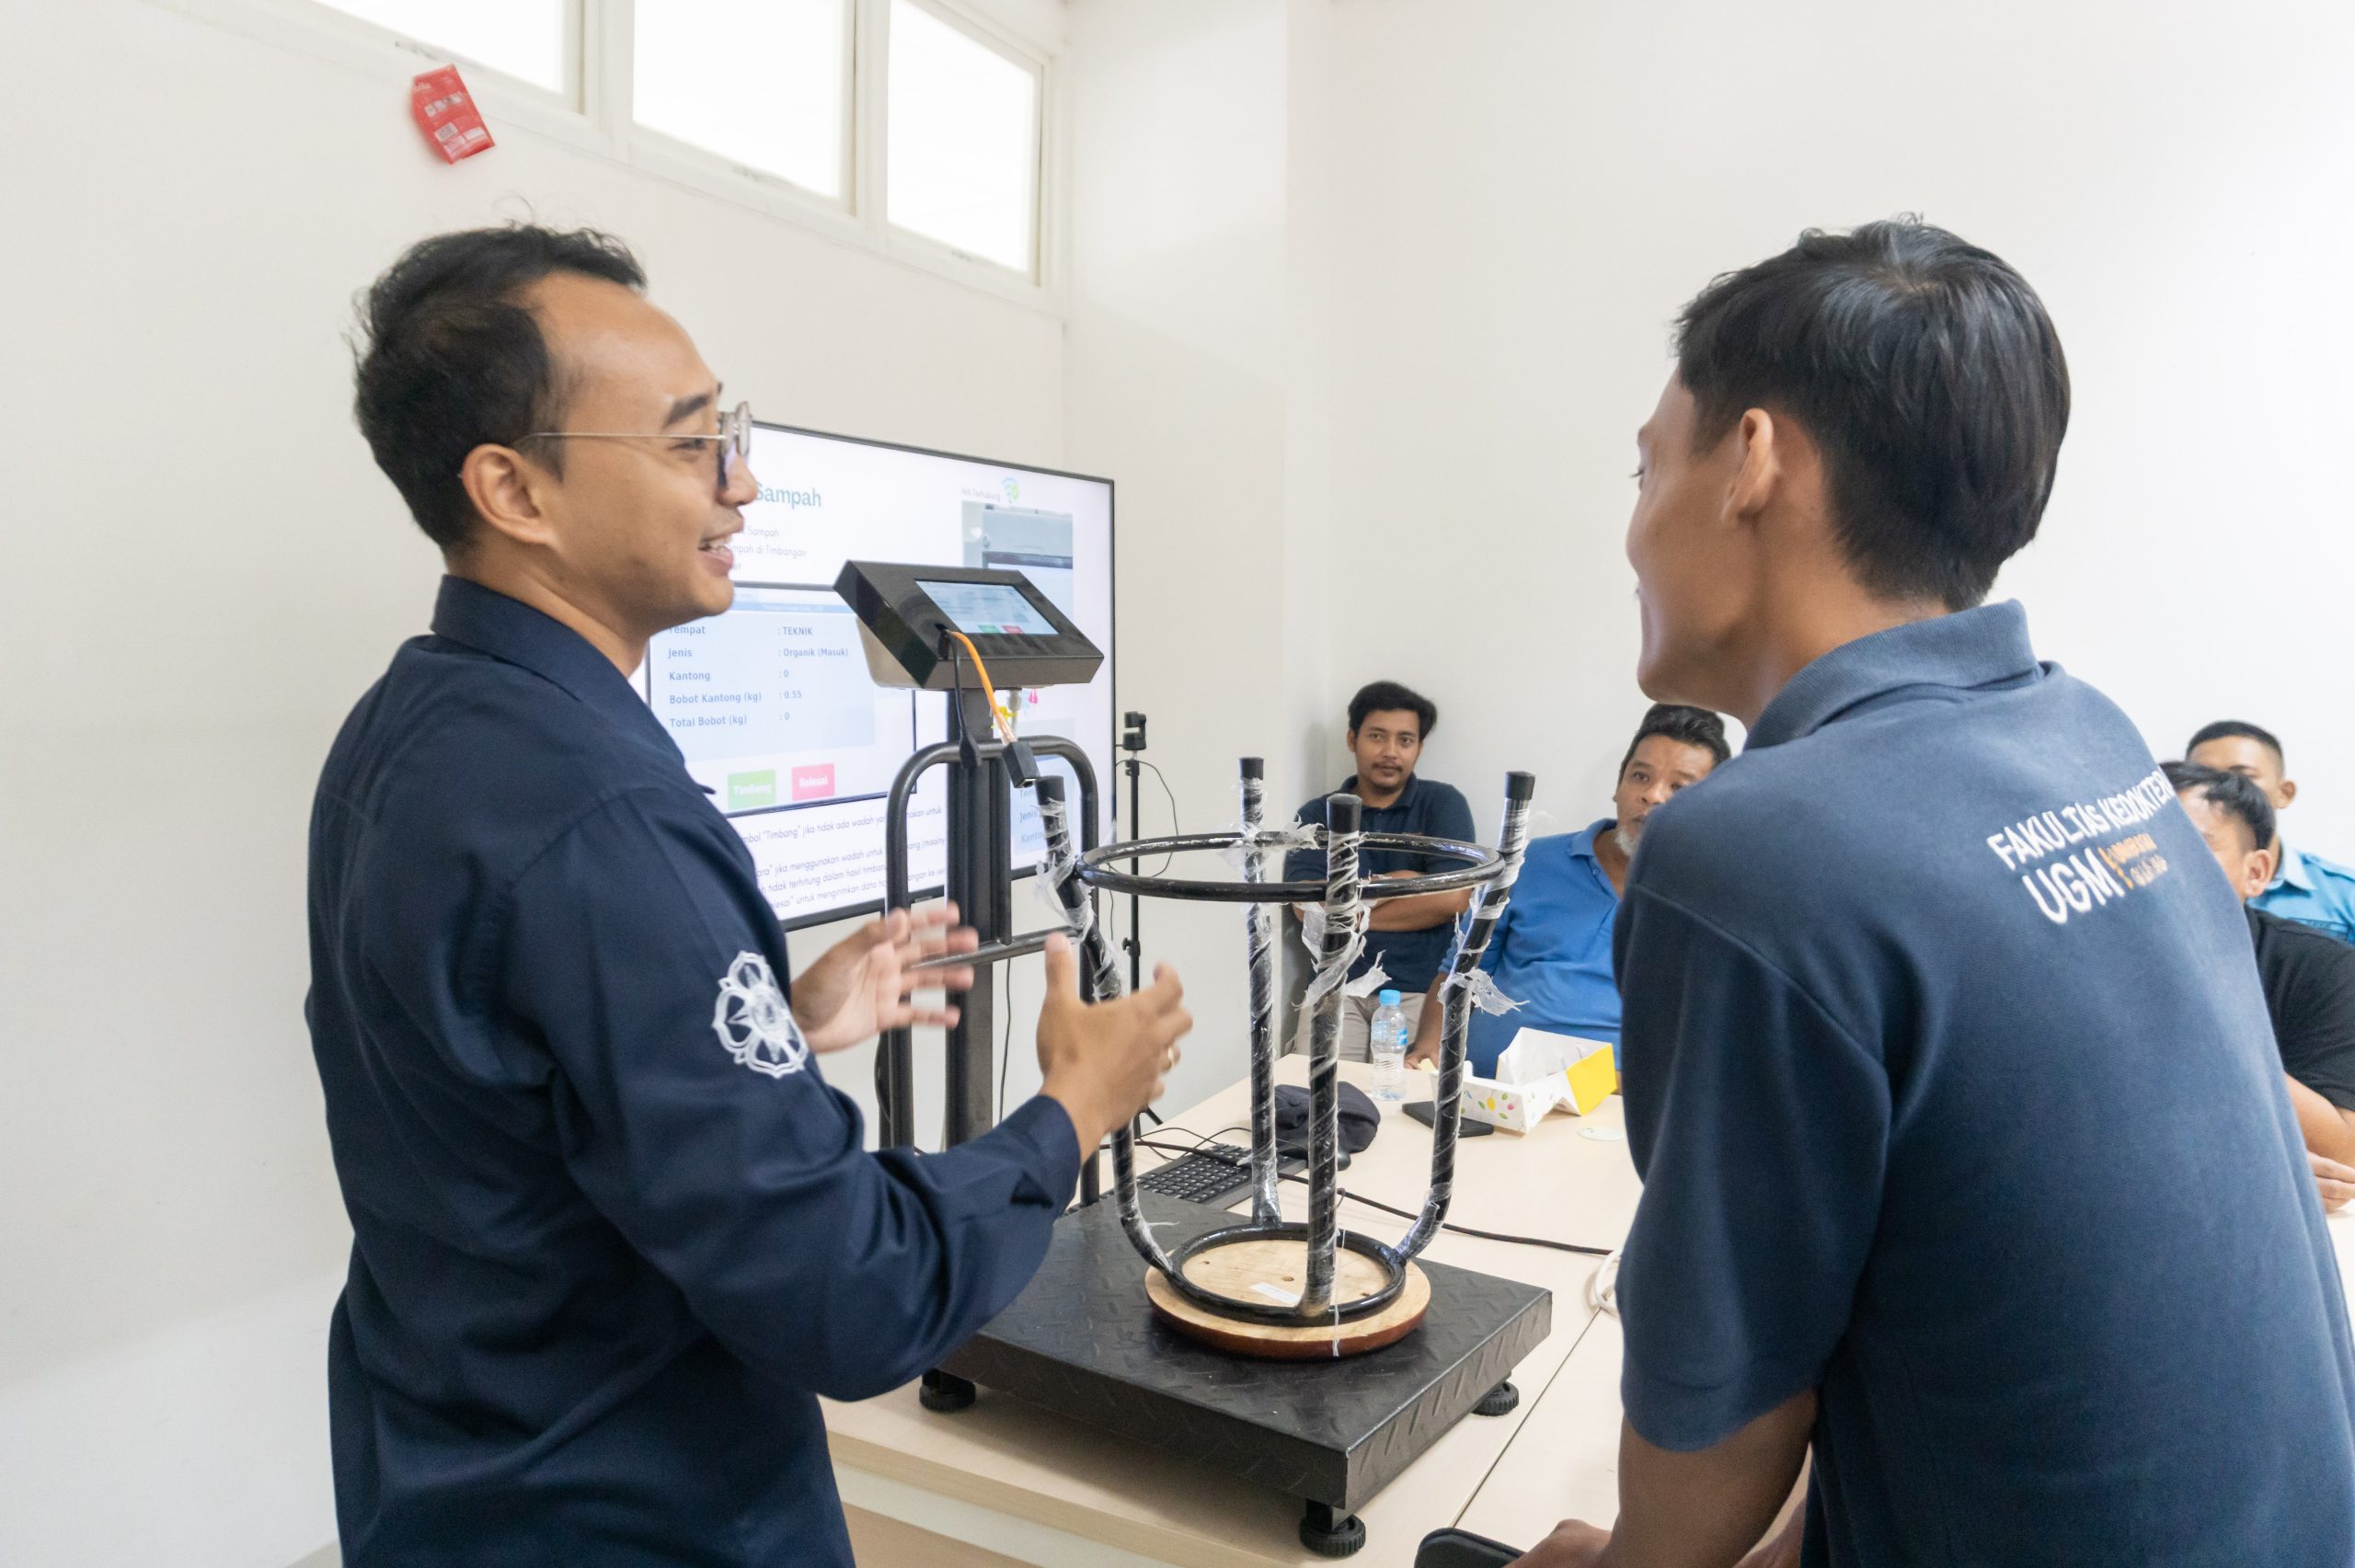
The presence of this dashboard allows previously scattered data to be collected within a more accessible monitoring system. As a result, users can compare data between units, observe changes in waste volume over specific periods, and identify waste categories requiring further attention.
Another key advantage of this system is its ability to present data in real time. Whenever waste is weighed, information regarding its weight and category is immediately transmitted to the connected dashboard dashboard. This process enables automatic updates without requiring repeated recording or periodic manual recapitulation.
Through this mechanism, managers can monitor waste generation patterns at any time. Information about dominant waste types and changes in waste volume can be identified more quickly, facilitating evaluation and decision-making processes.
Thomas added that the data obtained from this system does not stop at the recording stage. The available information can serve as a basis for determining future waste management strategies, including sorting and processing methods according to the characteristics of each waste category.
“If waste has already been separated, we know which materials are plastic, cardboard, or food waste. After that, the processing stage becomes easier. Data from this scale becomes the foundation for the next steps,” he explained.
Through IoT technology, the university now has a tool to monitor waste types and volumes more accurately. Real-time data is expected to help various units develop more effective waste management strategies while supporting sustainable environmental management across the campus.
Author: Fajar Budi Harsakti
Photo: Fajar Budi Harsakti